1307 words | 7 minute read
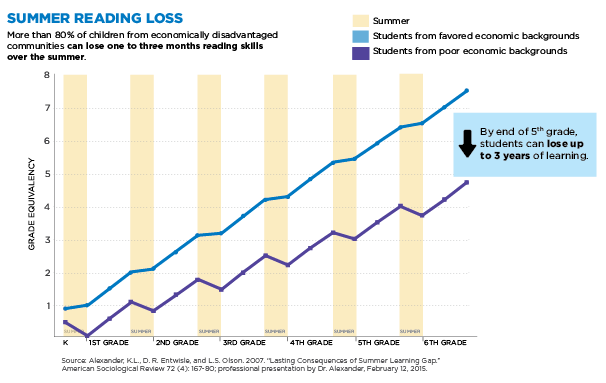
The presentations of summer learning loss can be quite alarming. Some of the rhetoric would lead one to believe that students from low-income backgrounds are losing months’ worth of reading knowledge while their more affluent peers are making gains over the summer. Can it really be true that a third grader living in poverty would return to school in the fall performing at the same level as during February or March of his or her second-grade year? At first glance, evidence such as the pictured graph would seem to confirm such a devastating setback.

The cream-colored shading is to designate the summer months, and the purple line representing the reading performance of students from low-income backgrounds is shown declining almost a half grade-level equivalent in each shaded (summer) segment. Moreover, this decline appears to be identical in every year from kindergarten to sixth grade, thus resulting in the purported three years’ loss of learning (6 years x -0.5 grade equivalents = -3 years).
Do the Data Back Up the Claims?
Just as we might expect students to do as part of the Iowa Core Standards, educators need to use critical analysis skills to evaluate claims about students’ learning. Let’s take a closer look at the graph as it is representative of the proof often given for summer learning decline. First, its presentation suggests it was derived from a study that analyzed archival data collected on students in Baltimore between 1982 (fall of first grade) and 1988 (spring of sixth grade). There is no description in the original article of what constituted the assessment in spring of kindergarten, a time point used to demonstrate the first loss on the graph. Students in the study were taking the 1979 version of the California Achievement Test (CAT; now referred to as the TerraNova/CAT-6), comprehension subtest. The authors do not report what constituted “comprehension” in Grades K-2, but at these grade levels, it would be impossible to reliably assess silent reading comprehension as we do for students from the end of third grade on. The CAT has separate levels and administrations for each grade level, so the students in the study would have been assessed on different skills when they were younger than when they were in their upper elementary years. In addition, it is dangerous to make assumptions about how students today are performing based on data from students tested and compared to norms that are over 30 years old.
Second, the researchers only had full data on 326 students, so they used a statistical procedure to impute or infer data on over 400 other students, thus arriving at the 787 students in their analysis. In other words, over half the sample represented in their results was based on a type of educated guess about student performance.
Third, students’ reading abilities are represented on the graph in grade equivalence scores, which are not valid indicators of growth over time because they are not based on an equal interval scale. Standard scores, percentile ranks, or scale scores would be far more appropriate for estimating growth. Looking at the graph, it appears that even the more capable students are plateauing each summer and not experiencing much, if any, improvement in their abilities. The original publication from which this graph is derived by Alexander et al. (2007) analyzed scale scores and did not report equal amounts of loss or stagnation between each grade level. In fact, the authors concluded that longitudinal differences between student groups were somewhat attributable to the greater growth experienced by the higher income students in the summers of their early school years. Therefore, it is unclear how this particular graph was developed, and why data from this study are used to demonstrate summer learning loss among students from low-income backgrounds
Putting Scores of Tests Administered Over Multiple Years Into Context
The norms and benchmark scores of tests administered over multiple years adjust for normal maturation and for changes in the difficulty level of the tests used in different grades. For example, the Formative Assessment System for Teachers Curriculum-Based Measurement for Reading (FAST CBM-R) commonly used in Iowa as a universal screening measure has different passages for third graders than for fourth graders. That is one reason why the benchmark for proficiency in spring of Grade 3 is 131 words read correctly, but the benchmark for the fall of Grade 4 is only 116 words read correctly. The benchmark adjusted down, in part, because the test passages students read are leveled by difficulty and will require more mature skills in fourth-grade than in third. Therefore, reporting that a student read 131 words correctly before summer but only 116 words correctly after summer does not mean the student suffered a loss of learning—even though we could plot a graph that made it seem as though that occurred.

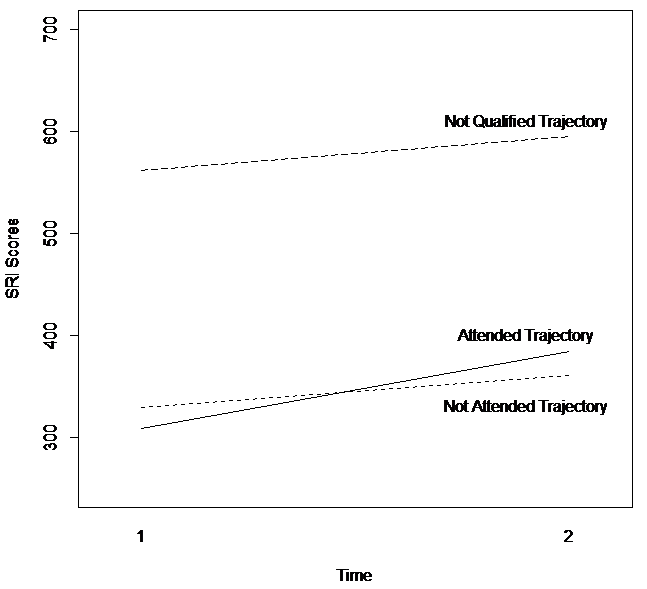
If reading performance were represented in developmentally or vertically scaled scores, we could better see whether students were improving, maintaining, or declining over the summer. This graph created from data obtained by the Iowa Reading Research Center from the Council Bluffs Community School District in 2015. The top line reflects the change in typically achieving students (i.e., labeled not qualified for summer school, or those who are reading at or above grade level) from spring of Grade 3 to the fall of Grade 4 on a developmentally scaled measure of reading. It is apparent that these students generally mature in their reading abilities, even though they are not involved in formal education over the summer. The bottom two lines represent below-level readers who did (attended) and did not (not attended) participate in a summer program offered between the end of Grade 3 and the beginning of Grade 4. On average these students still grew some, but they did not close the gap between their performance and that of their more capable peers. For those who did not attend summer school, the gap actually widened, despite their small gain in ability.
How might this come to be interpreted as a loss in their learning that took place during the summer? The not attended students returning to school in the fall would seem worse off relative to their not qualified and attended peers than they did when they left school in the spring. In that sense, the not attended students did lose ground. The other students grew more than they did. Although the not attended students may have some rusty skills or have forgotten a few discrete facts, they did not forget months’ worth of knowledge about reading. Rather, they are now being held to a higher expectation that the not qualified students are able to meet. The lowest performing readers experienced a decline relative to the performance of the higher ability readers and those who attended summer school.
In our statewide Intensive Summer Reading Program study of summer reading programs conducted in 2016, we held constant the grade-level expectation for performance. That is, we consistently tested students with the reading measures designed for third graders. We found that the average student performance was maintained over their 4-6 week programs, but those programs did not operate for the full summer. We do not know what students’ performance would be relative to a developmental scale that accounted for expected maturation over the entire 2.5 months between the end of Grade 3 and the beginning of Grade 4.
Conclusion
Summer is an important time for students to be engaged in literacy activities, especially if they already are experiencing difficulties with reading. Being away from structured learning opportunities, such as a summer reading program, seems to disadvantage the students who can least afford to grow more slowly than their peers. However, we need to be accurate when we describe what happens to them during those months and provide credible evidence for claims about all students’ performance.
References
Alexander, K. L., Entwisle, D. R., & Olson, L. S. (2007). Lasting Consequences of the Summer Learning Gap. American Sociological Review, 72, 167-80. doi:10.1177/000312240707200202 ¦ Article
